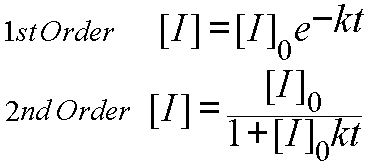
The usual kinetics equations for
first and second order reactions are

But don't bother to use these equations; they won't work very well. These equations are derived on the assumption that the light intensity (like a reactant concentration) will approach zero at infinite time. The signal from your photodiode does not approach zero; therefore, you will find that your nonlinear fits will be vastly improved if you include a term for the background signal:

You could subtract the background from all the data as suggested in part 2, but it is actually more elegant to let the nonlinear fit determine the best value of the background correction. Chances are that your last data points aren't very good guesses for the true background voltage. Solver will do a better job of figuring out what that value should be. Solver should optimize three parameters, I0, Iback, and k, the rate constant.
Which order gives the better fit (Smaller sum of the squared errors)? Place your results in a table. Be sure to show a graph of at least one colored toy's data and the best Solver 1st order and 2nd order fits to the data.
4) The data for the different colored toys should
exhibit the same decay order. However, they may not have the same
rate constant. Be sure to compare the rate constants for the different
toys: are they same with in experimental error?