Example Seismograms
The seismogram below is the first to be recorded with the SIMA software package, which started operating with the long-period seismometers during the late summer of 2002. The image below is a thumbnail, so clicking on it will enlarge it. The data file, however, is very big, so it may take a while to download.

Central Alaska, 11/02/2002
Person walked in lab (bottom trace)
about 5 minutes before arrival of P waves.
The seismogram below was recorded by the SIMA software package during the evening January 21, 2003, while 24 students were in the Earth Science laboratory for an Astronomy class. Formal instruction was halted soon after the arrival of the "P" waves when some students noticed that several seismometer traces on the television screen were all responding. About a minute later, someone on the maintenance staff used a walkie-talkie, creating interference on two of the four traces. About a minute after that, the entire class came to the front of the room to observe a free-hanging pendulum which I keep in an 8-foot long, vertical Plexiglas case to see if the motions could be observed with the unaided eye. They could, although just barely. The motions of the class to see the pendulum in the front of the room, and then returning to their seats, are recorded well on the bottom trace because that seismometer is located in the rear of the classroom. During the arrival of the surface waves, the class again came to the front of the room to see the pendulum in the Plexiglas case. The motions were of the free-hanging pendulum were easily seen by every student. The disturbances caused by the motions of the students are not apparent on the bottom seismogram below because the surface waves are already off scale.
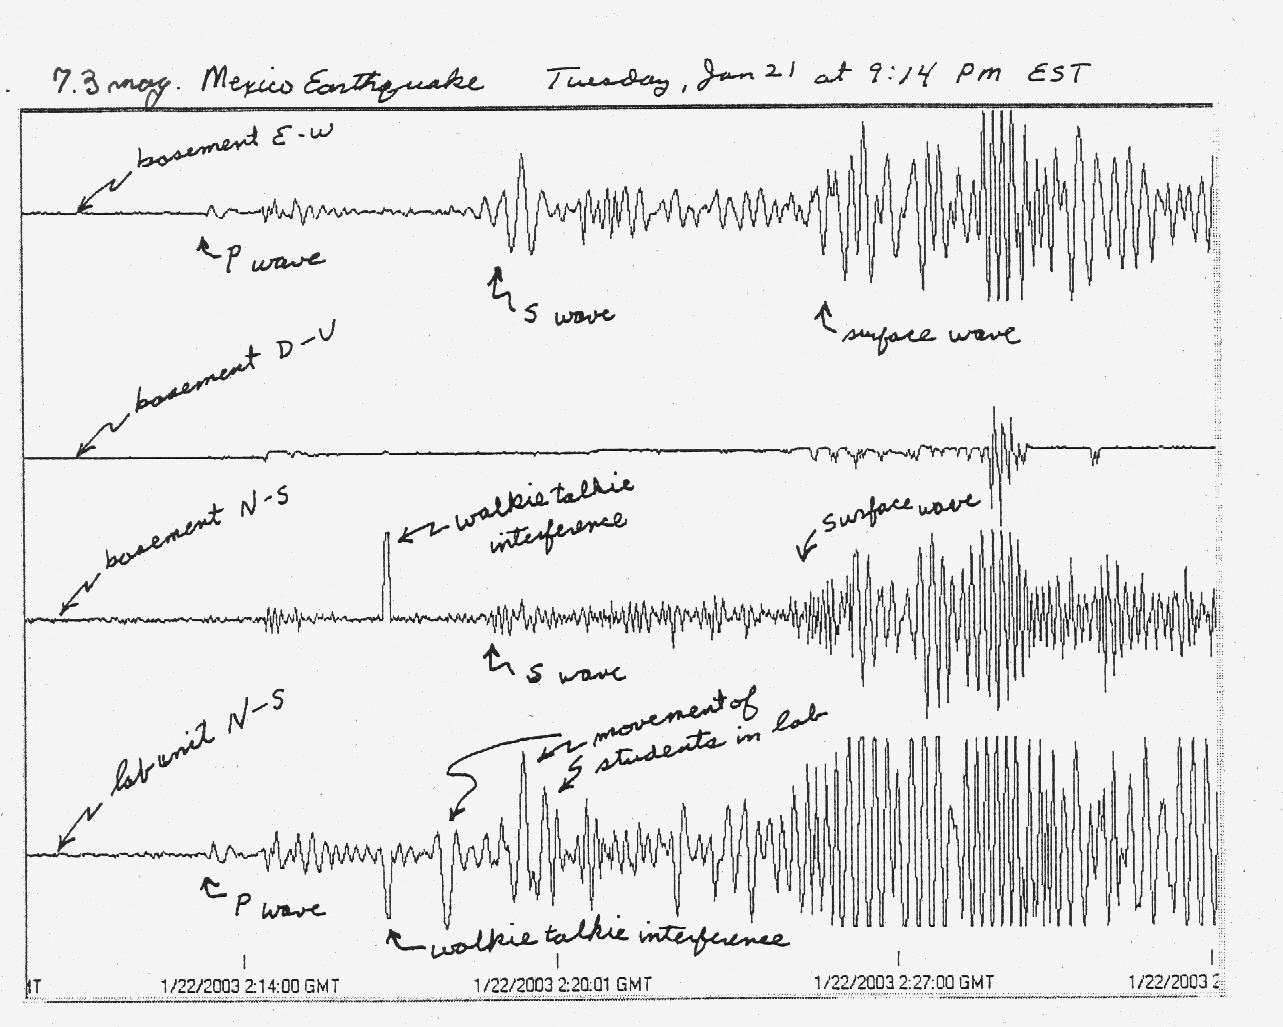
Western Mexico, 01/22/2003 (UTC)
Recorded while a class of 24 students were in the classroom.
All 14 example seismograms which follow on this page were recorded on the Apple IIe microcomputer by the SAS software, which was written in 6502 assembly language by Ron Jackson while he was a student at Moravian College during the late 1980's. The images below are thumbnails, so clicking on any image will enlarge it for a more detailed view. Be advised, however, that the data files are very large in order to show the detail of the traces, so if you have a slow connection the image will require a long time to transfer.
Long-period System
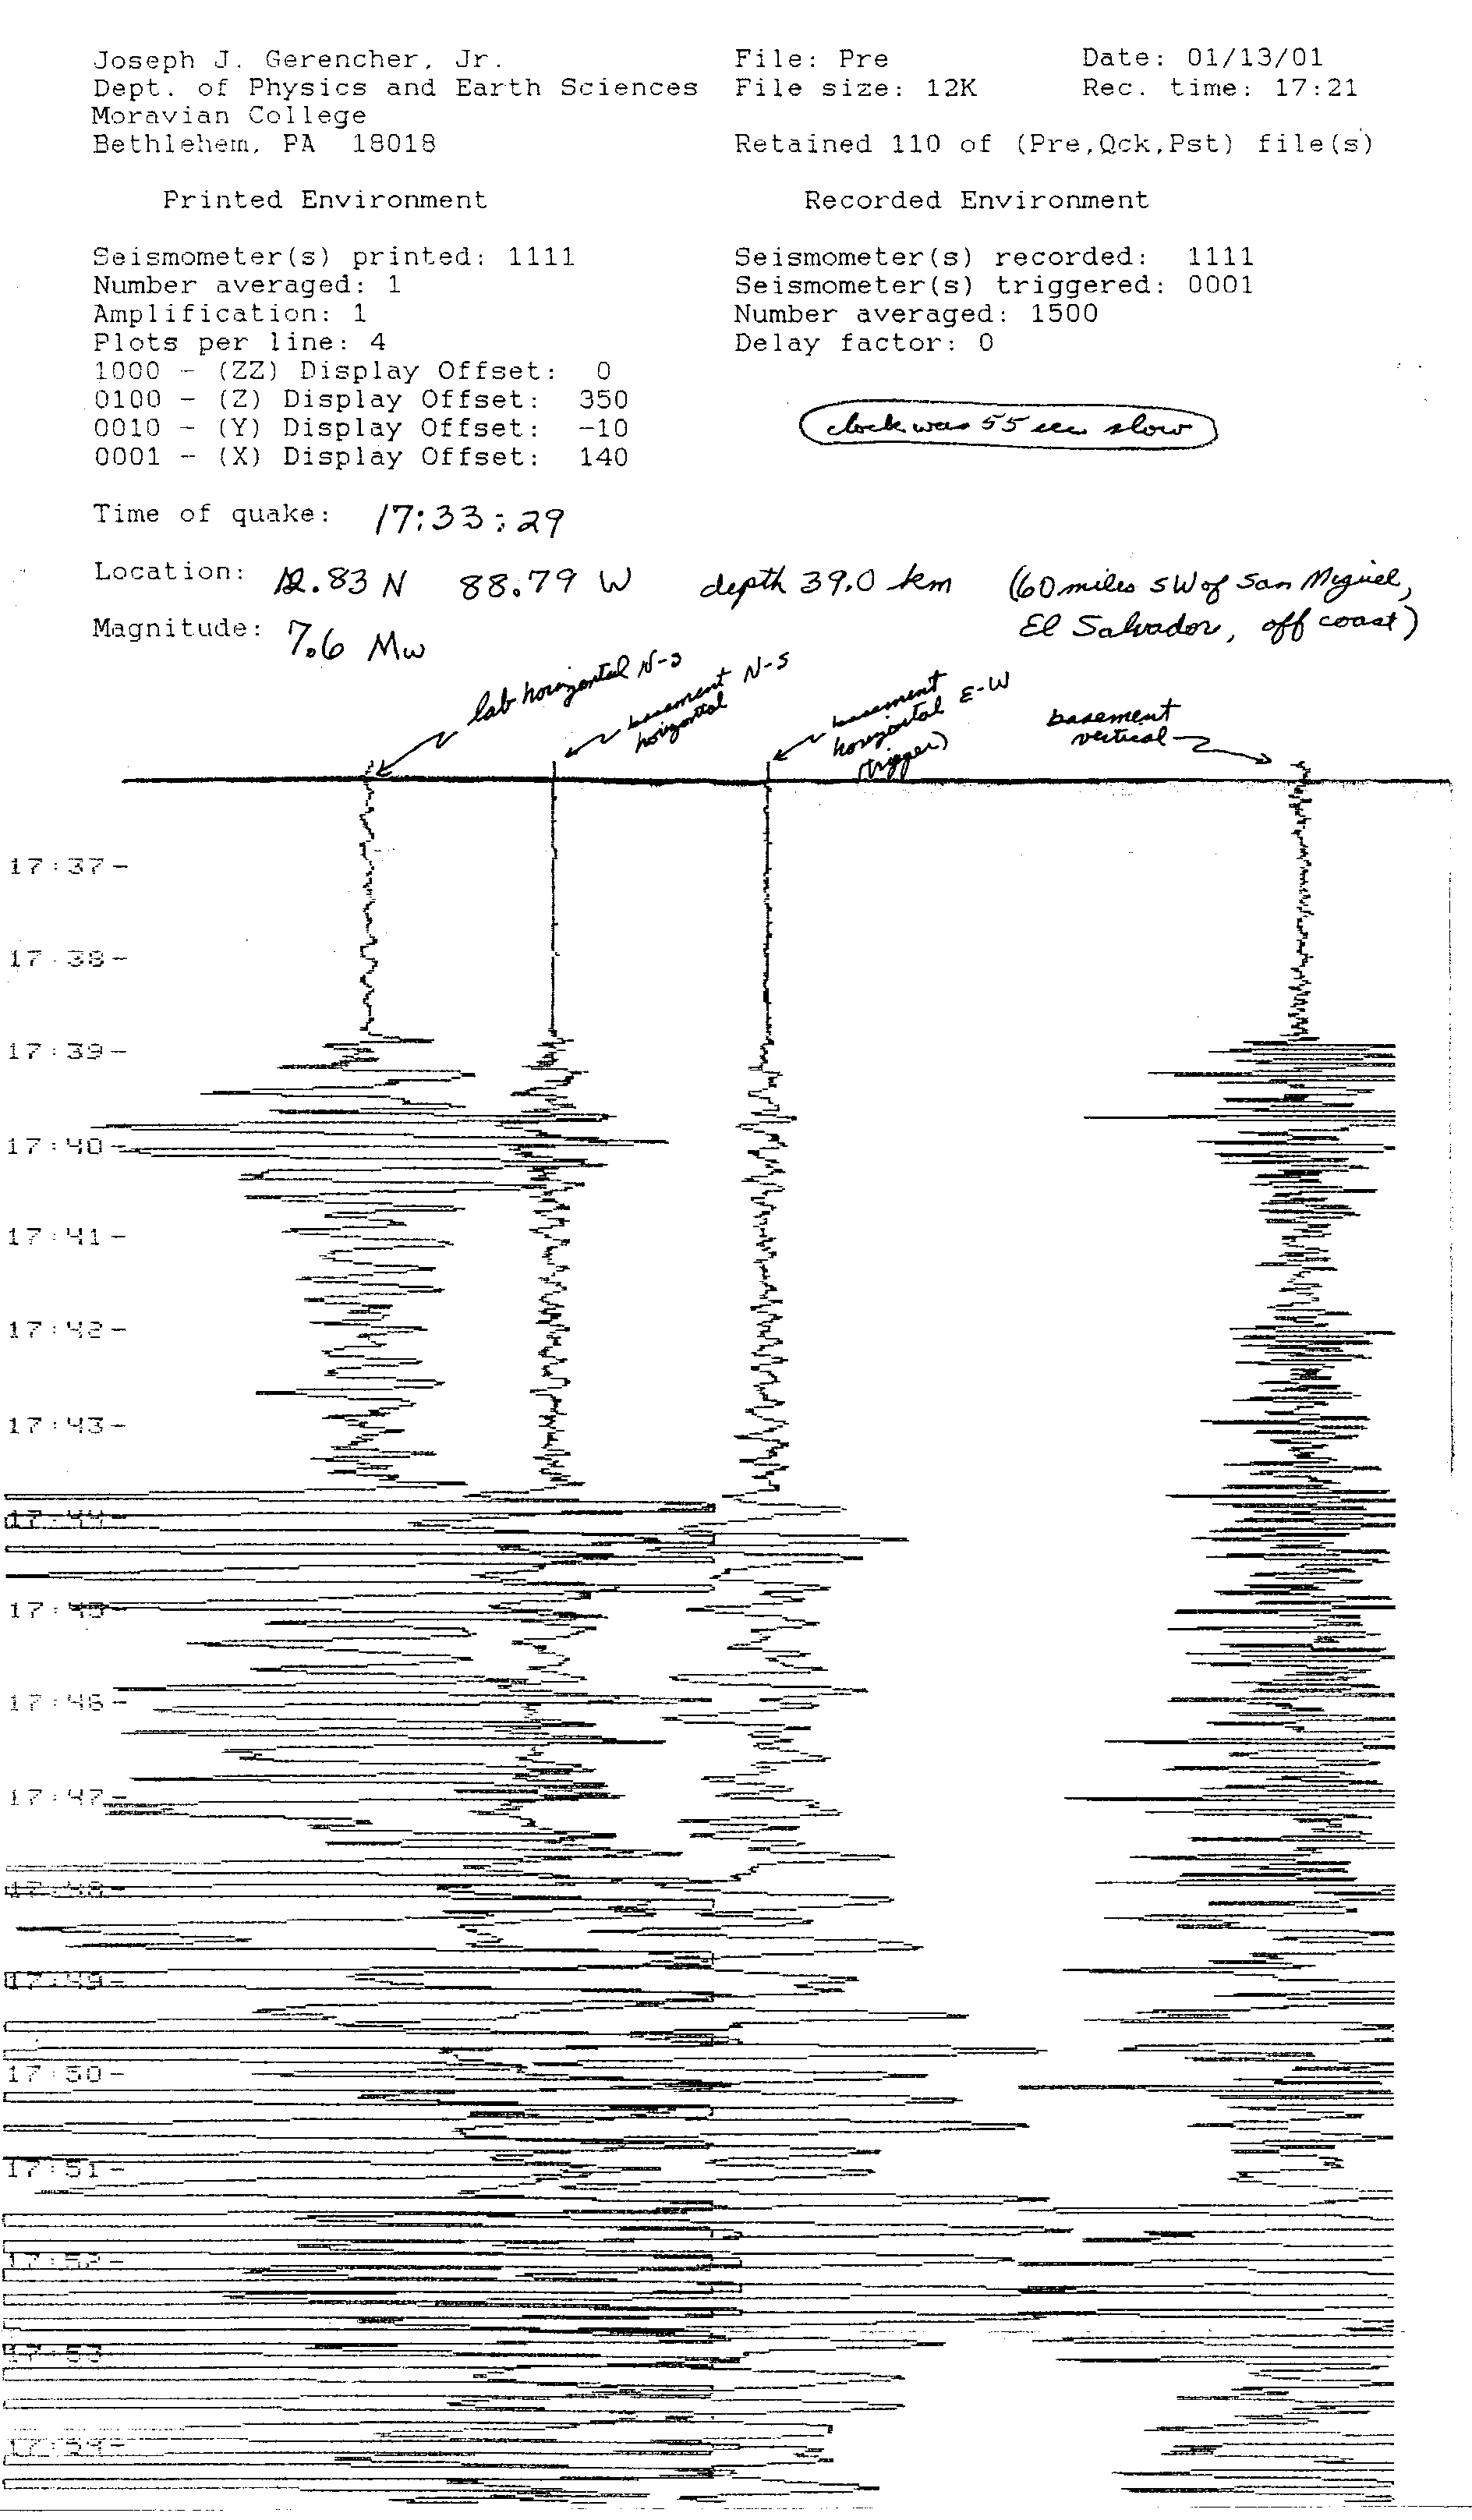
El Salvador, 01/13/01
(same earthquake as the first short period example)
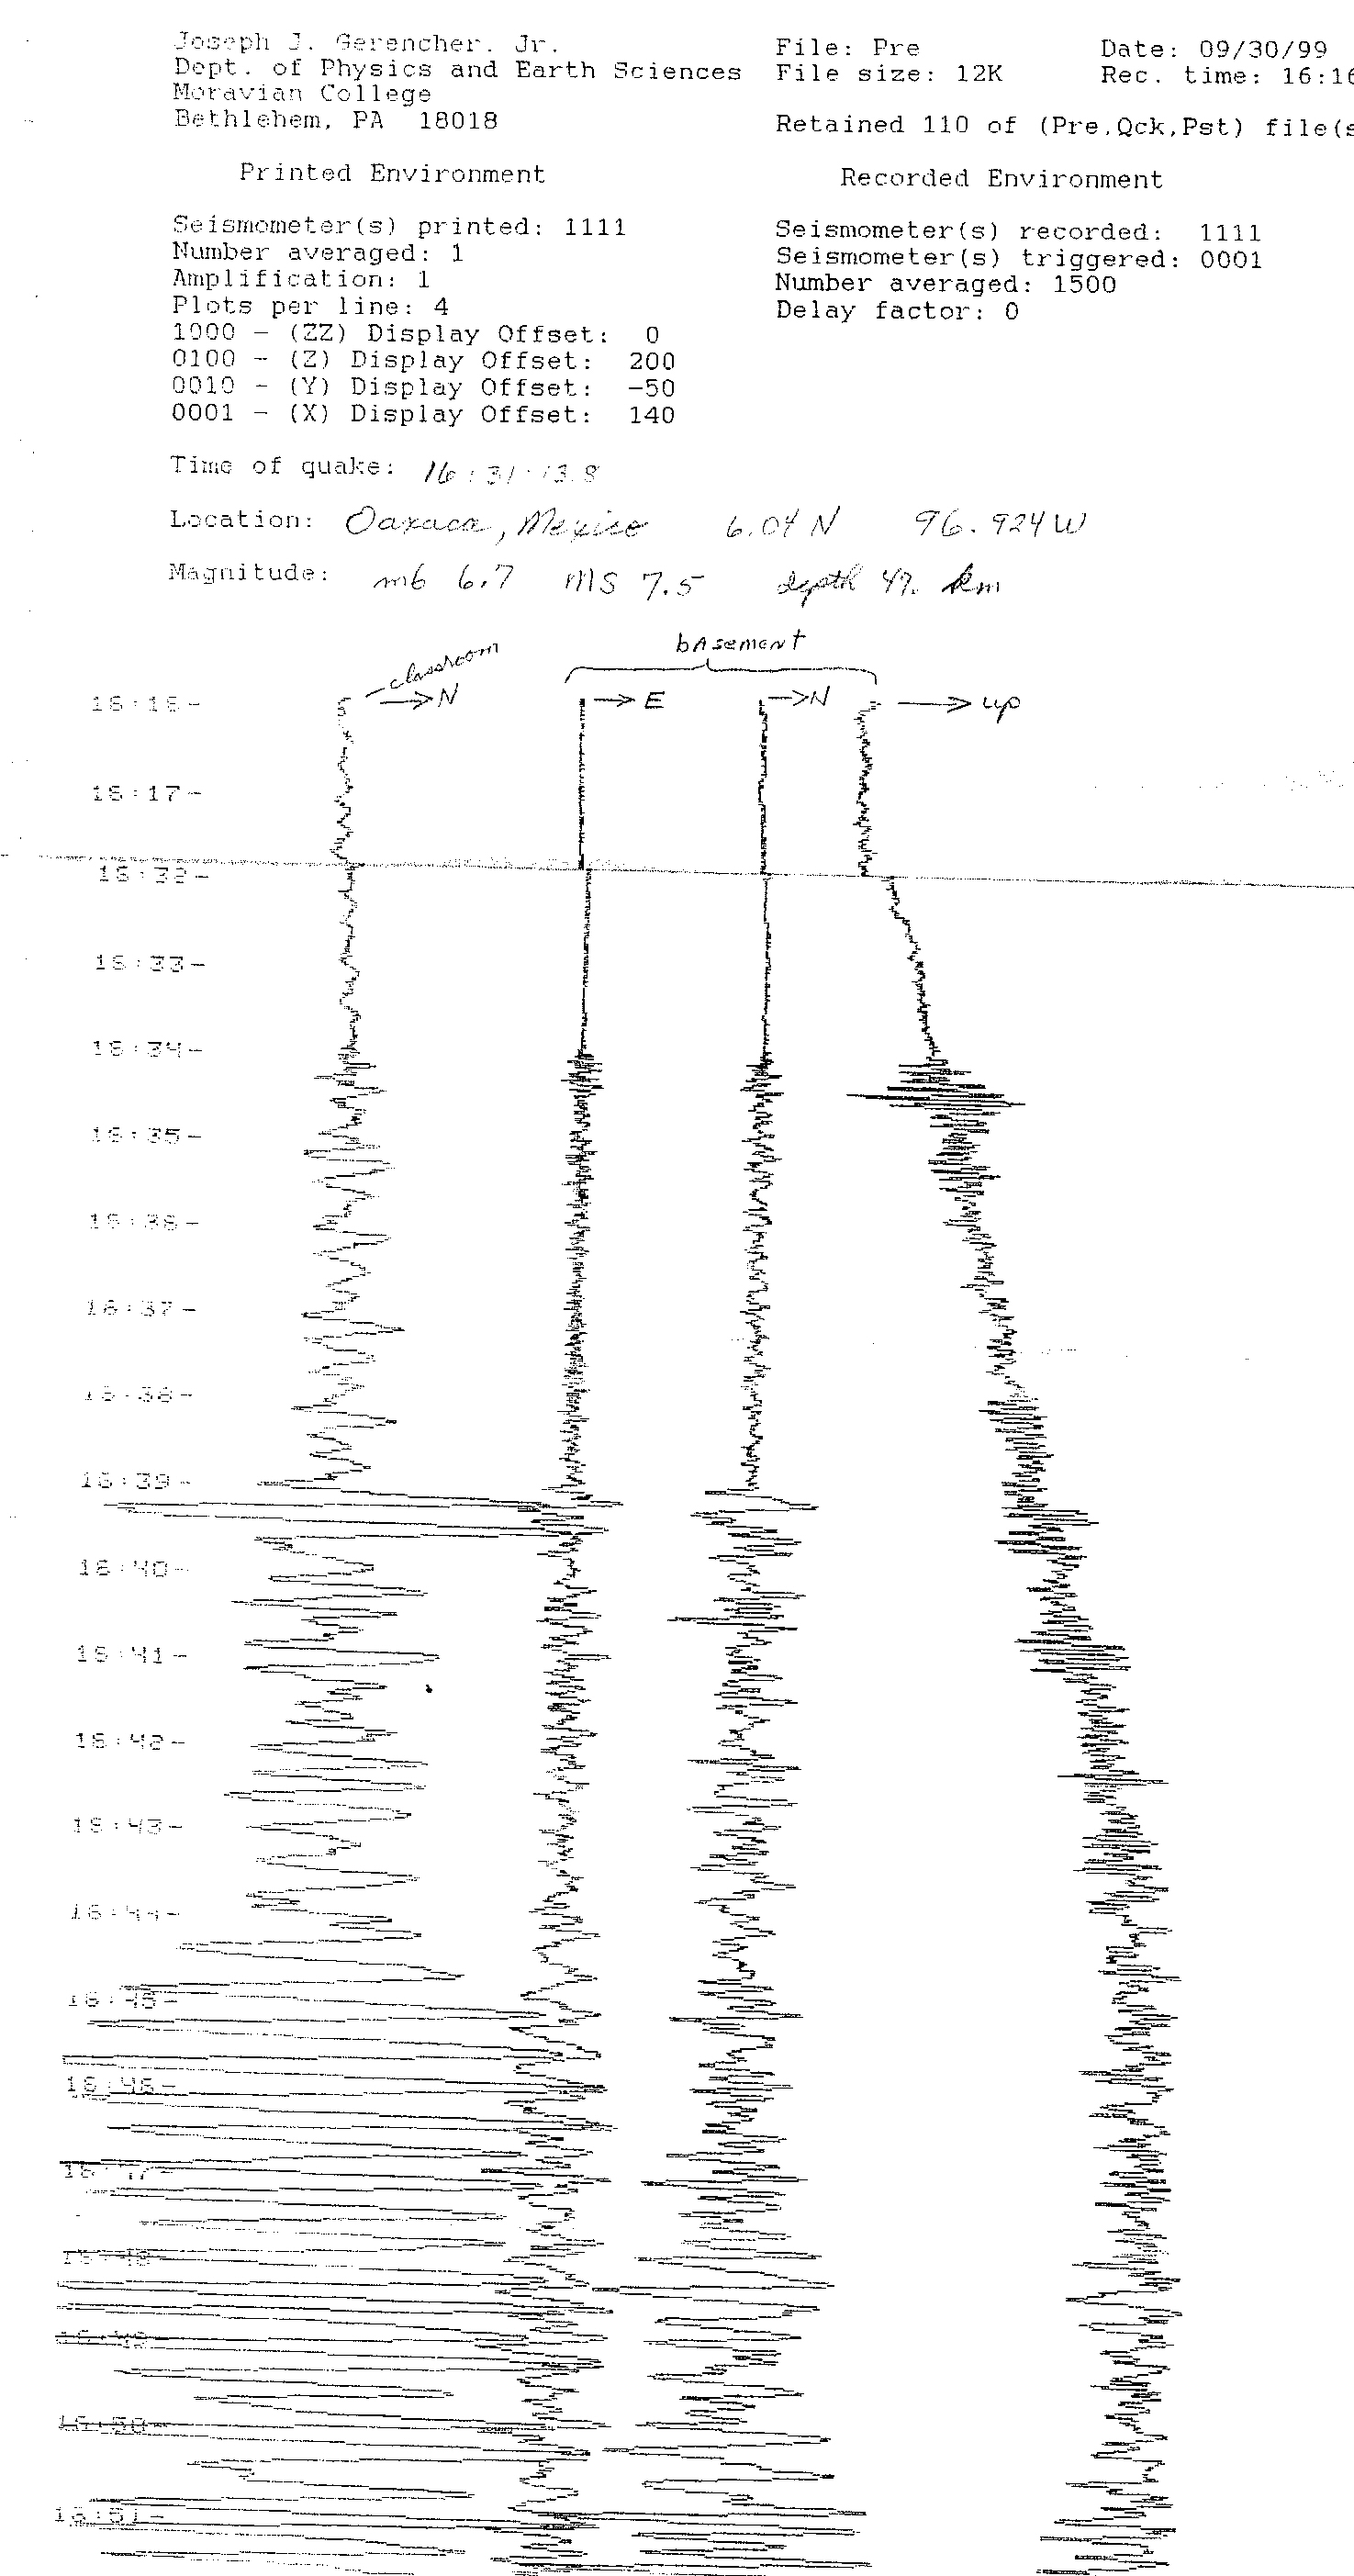
Mexico, 09/30/99
(notice the drift of the one home-made amplifier)
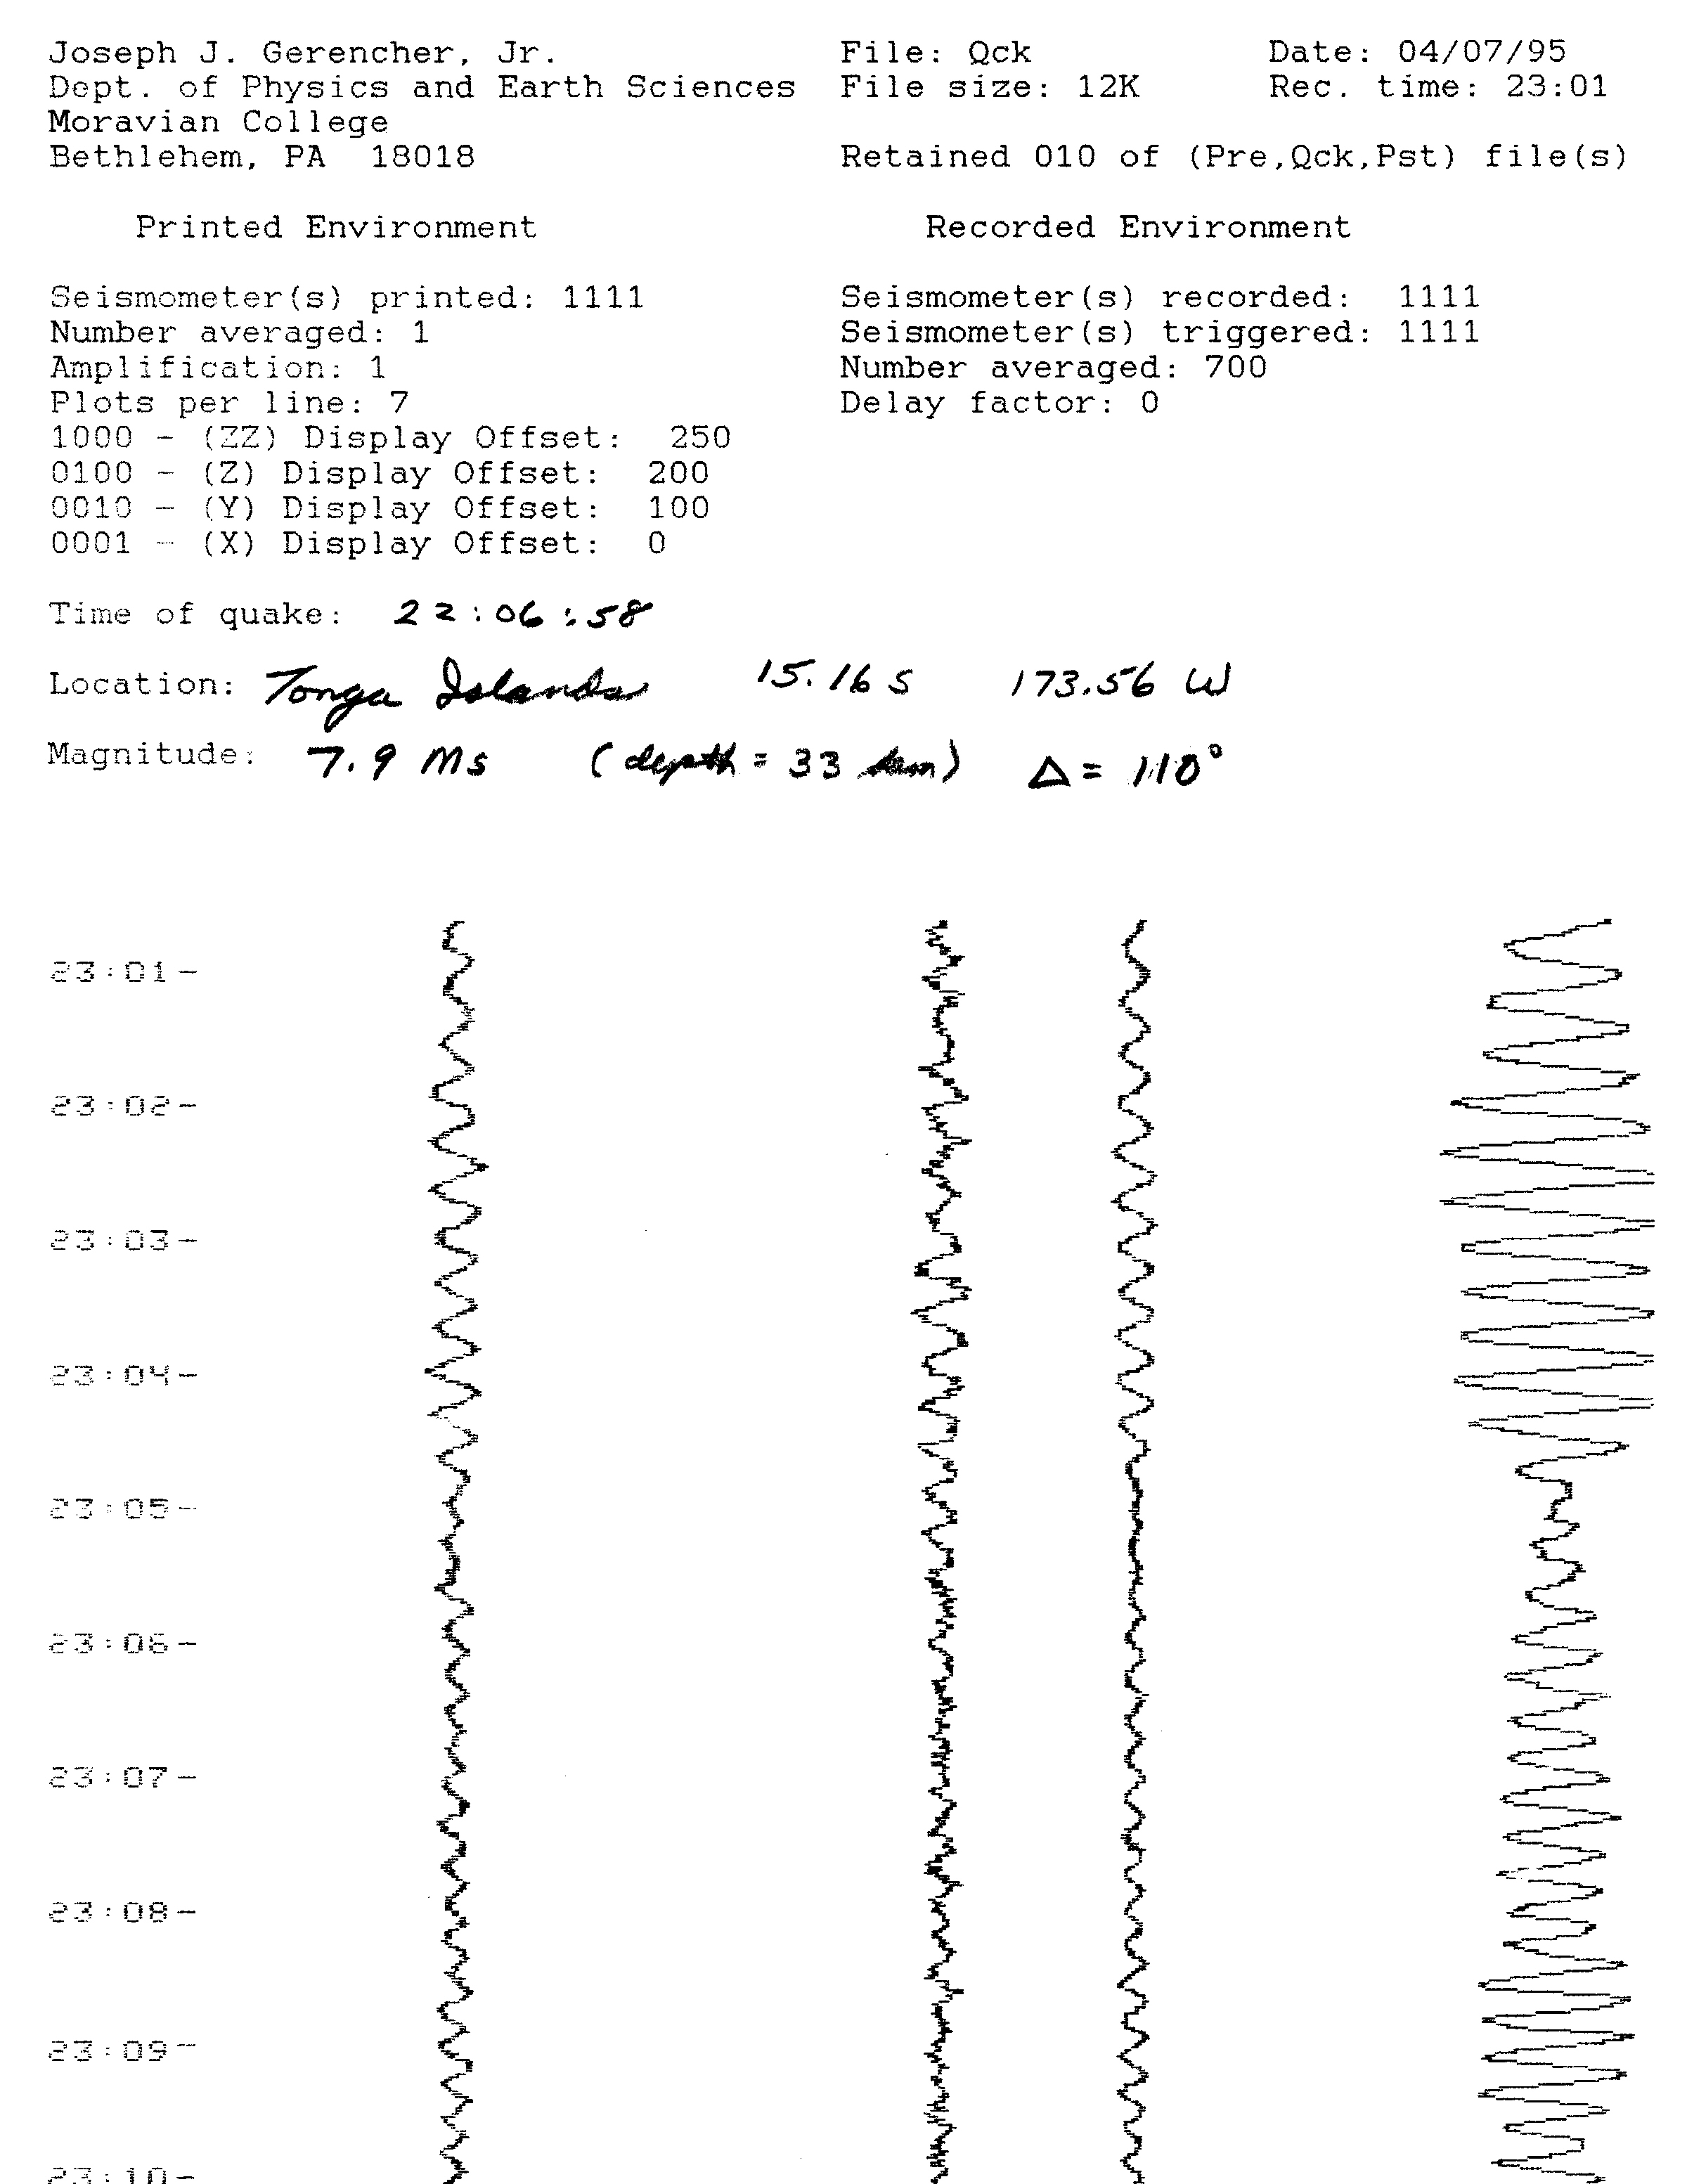
Tonga Islands, 04/07/95
(sensmometer identities and orientations were
not recorded on the seismogram)
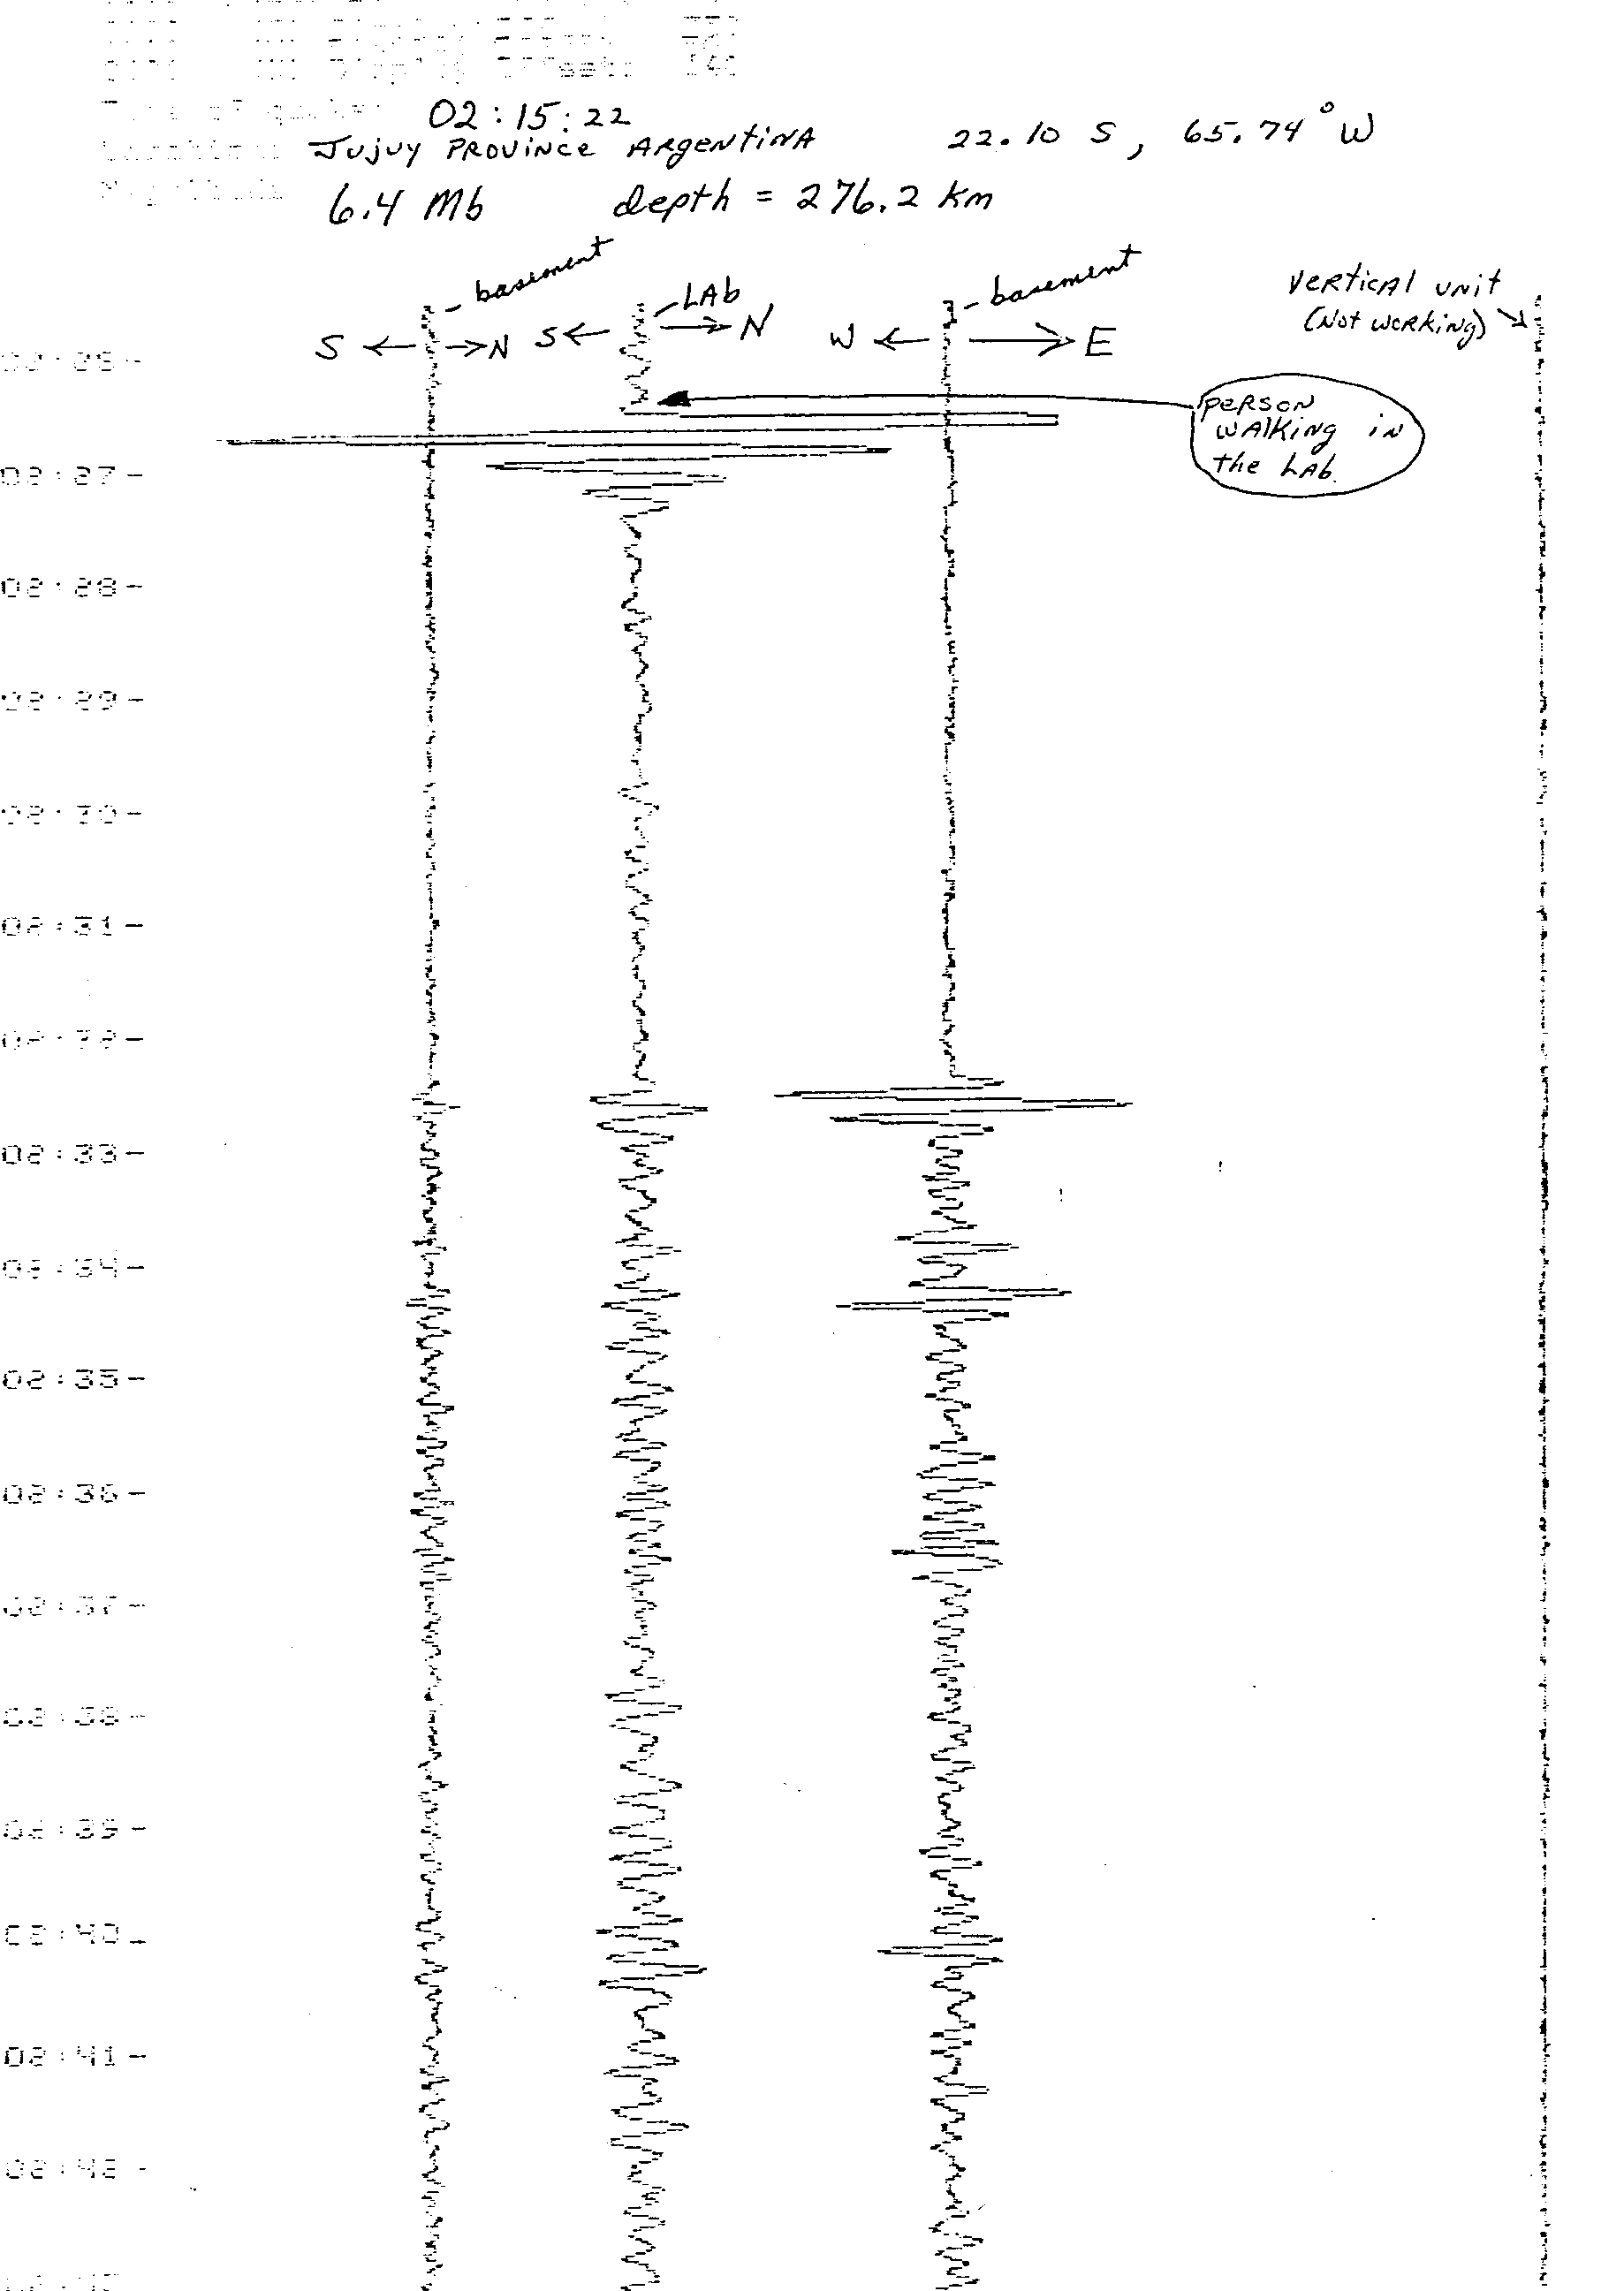
Argentina, 01/23/97

California, 10/16/99
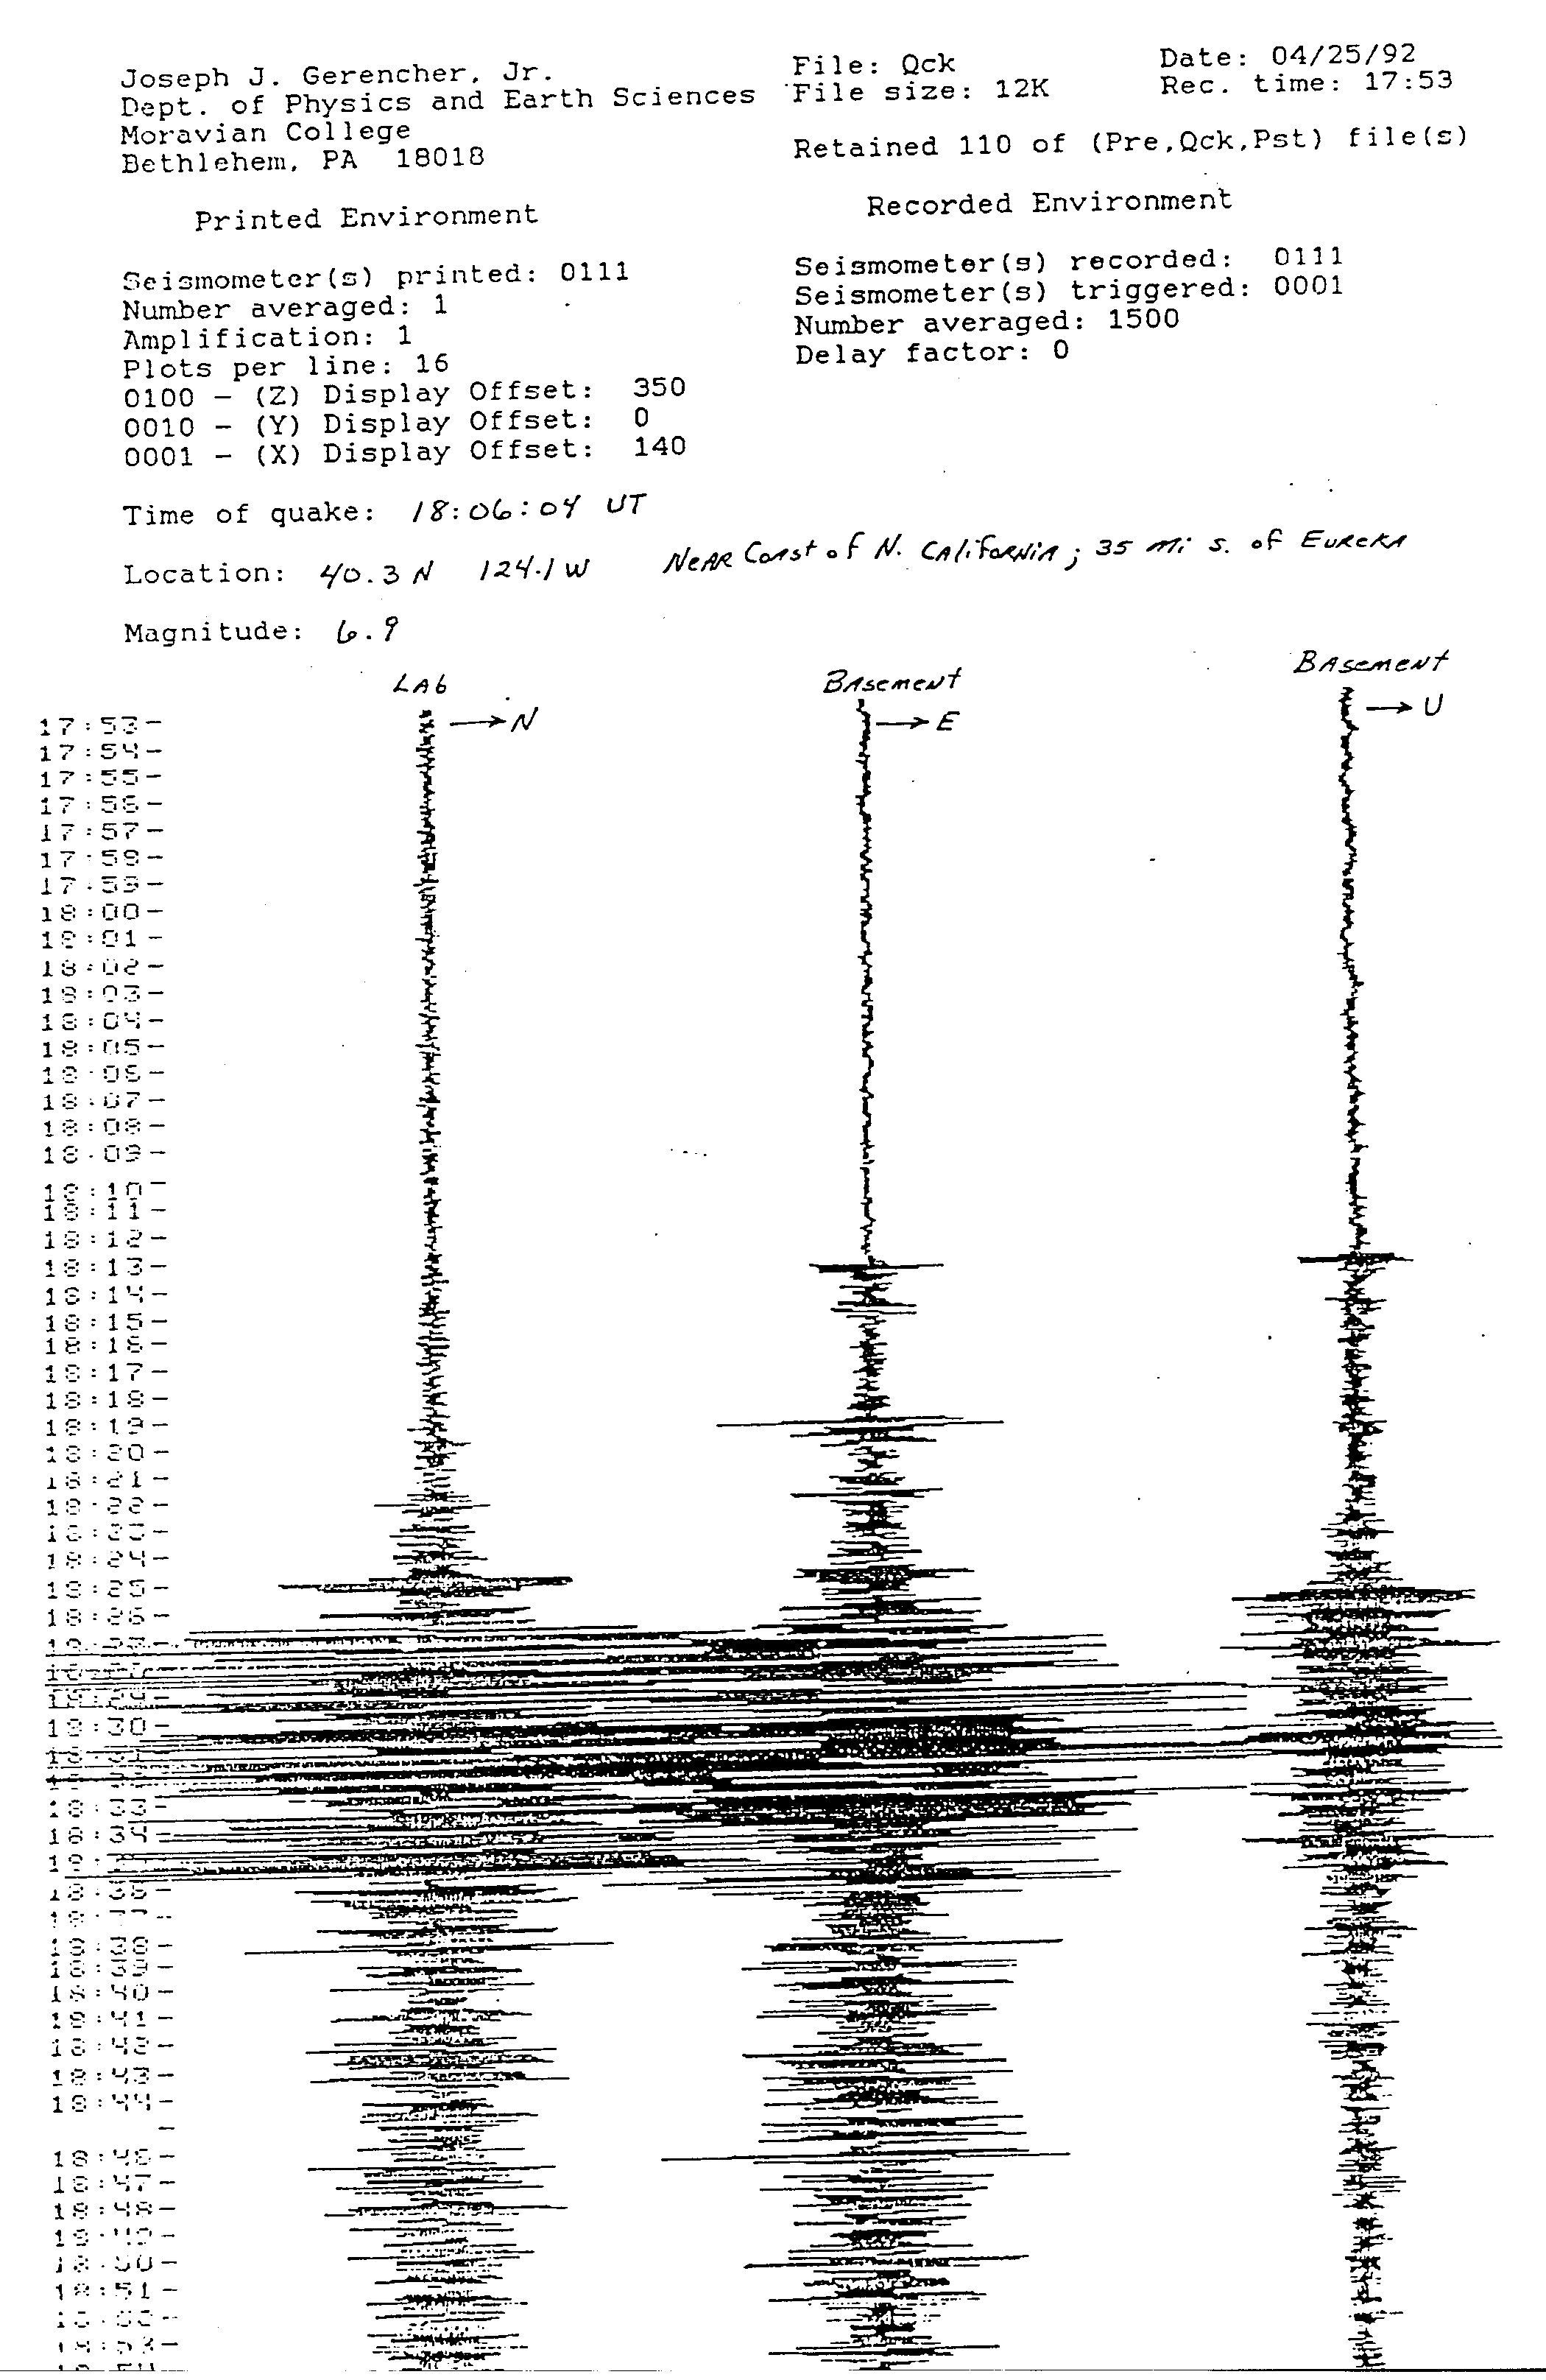
California, 04/25/92

California, three aftershocks associated with the event above, 04/25/92
Short-period System

El Salvador,01/13/01
(same earthquake as the first long-period example)
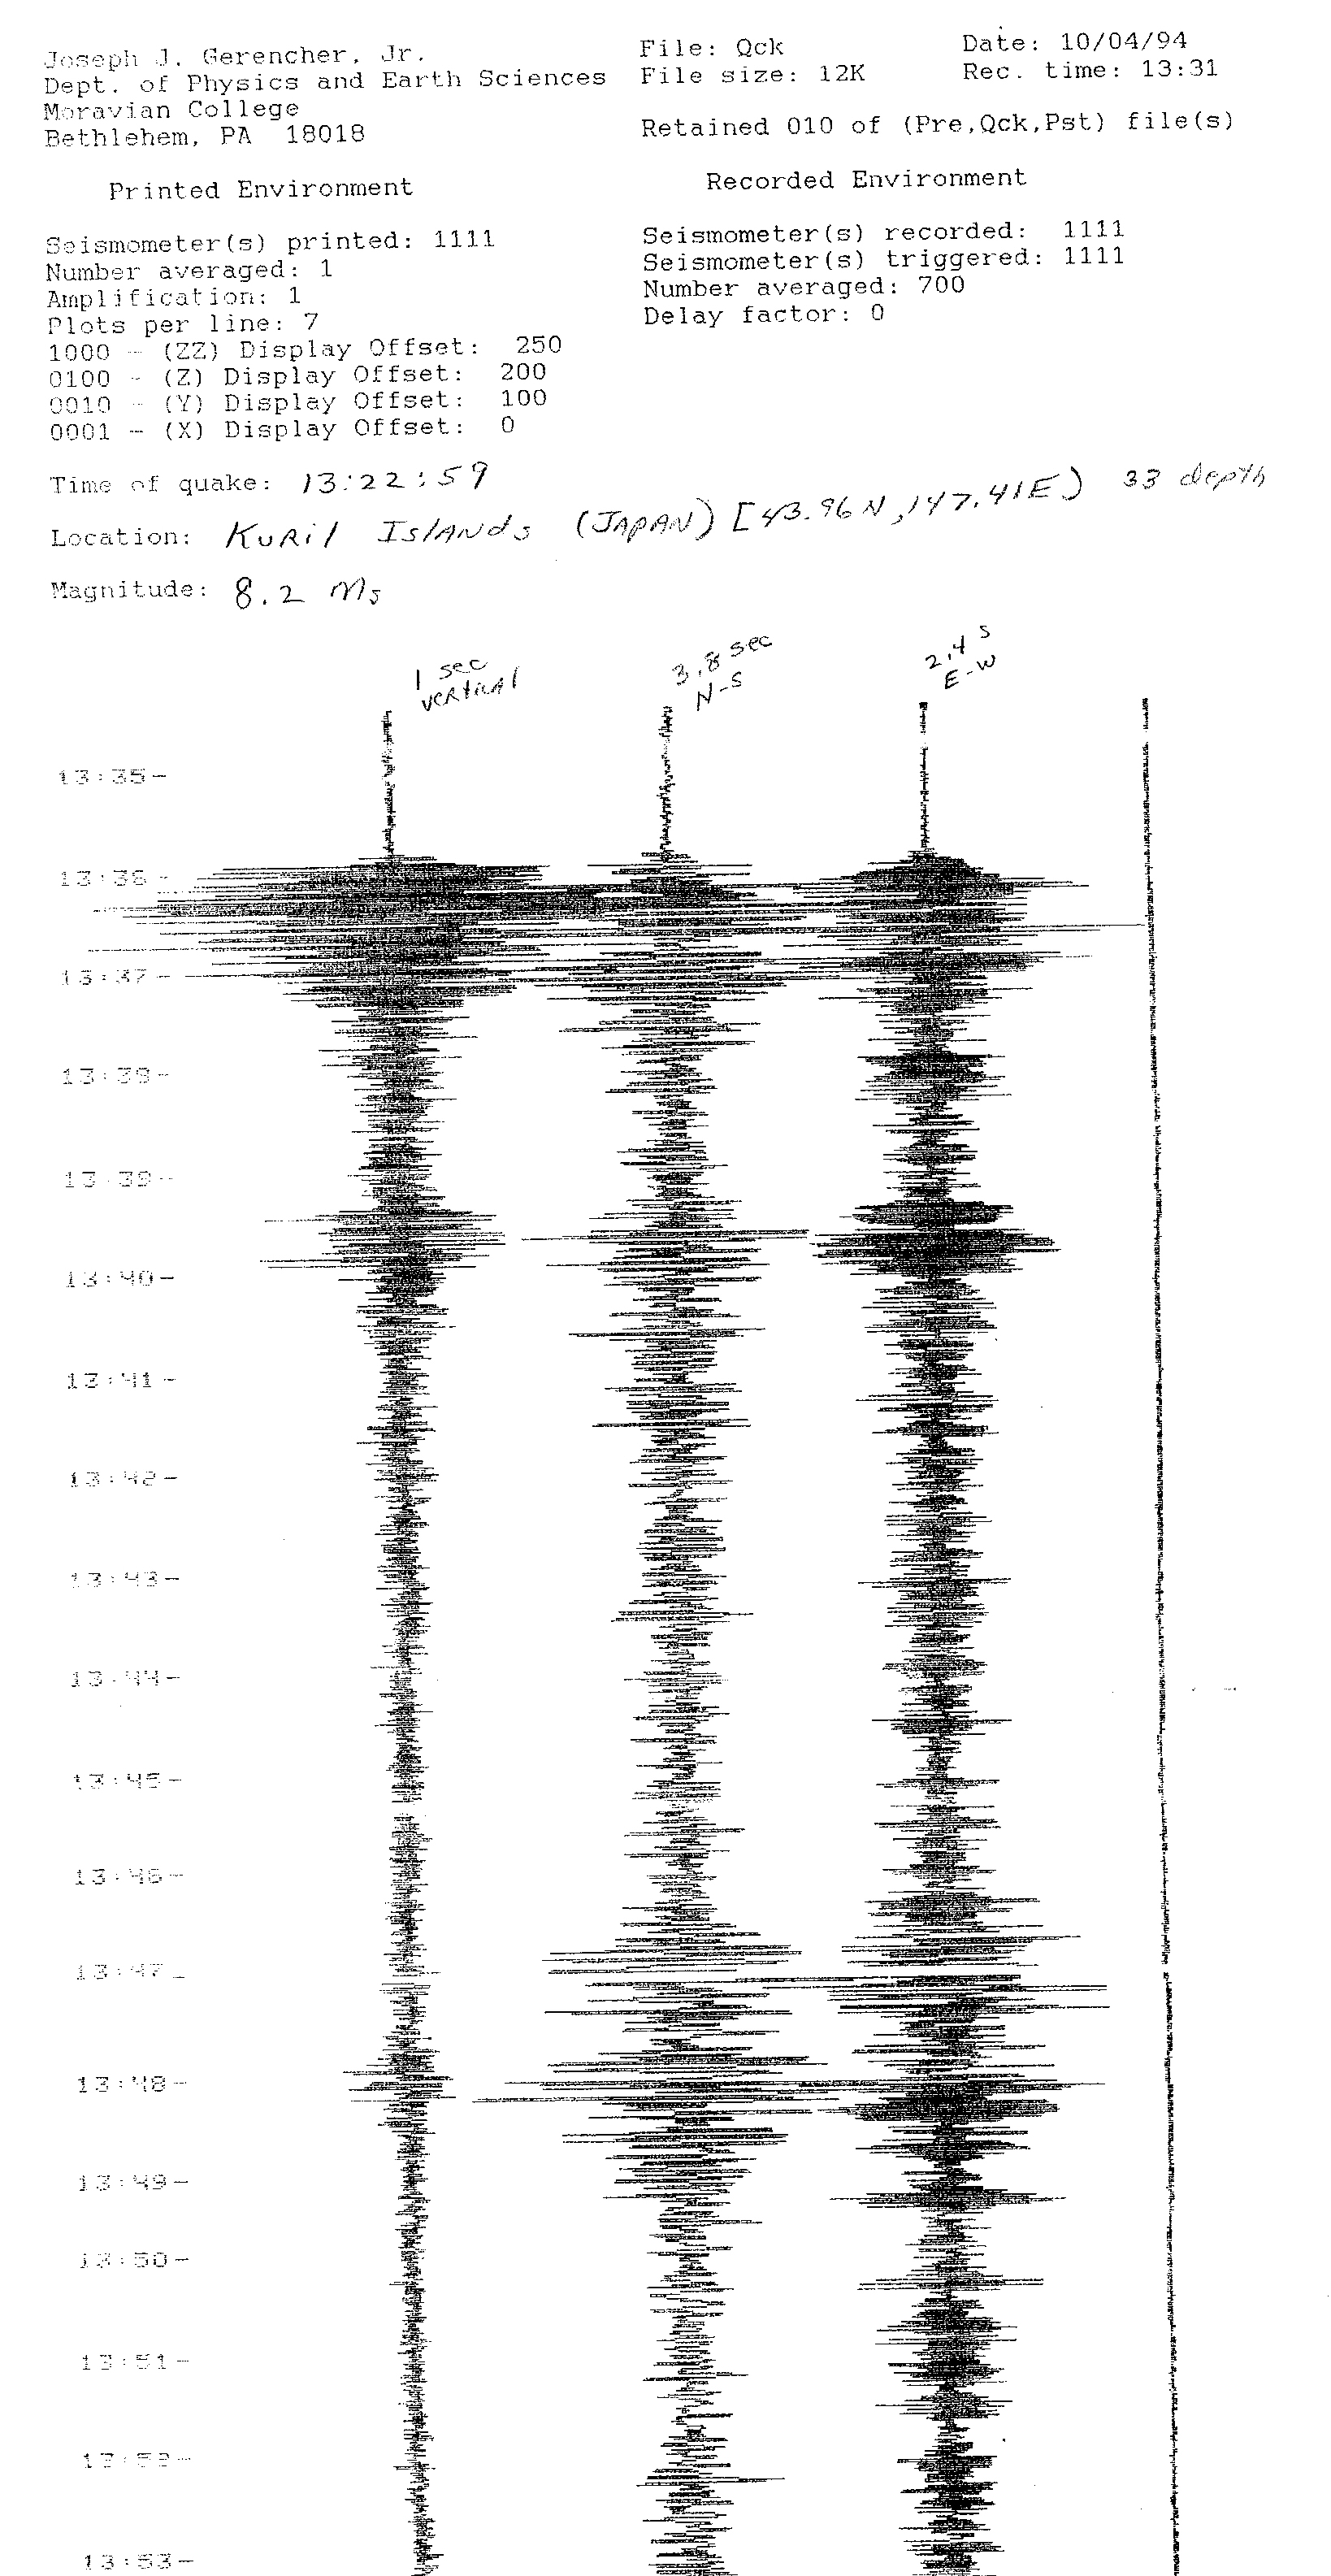
Japan, 10/04/94

Ohio, 09/25/98

New York, 04/20/00
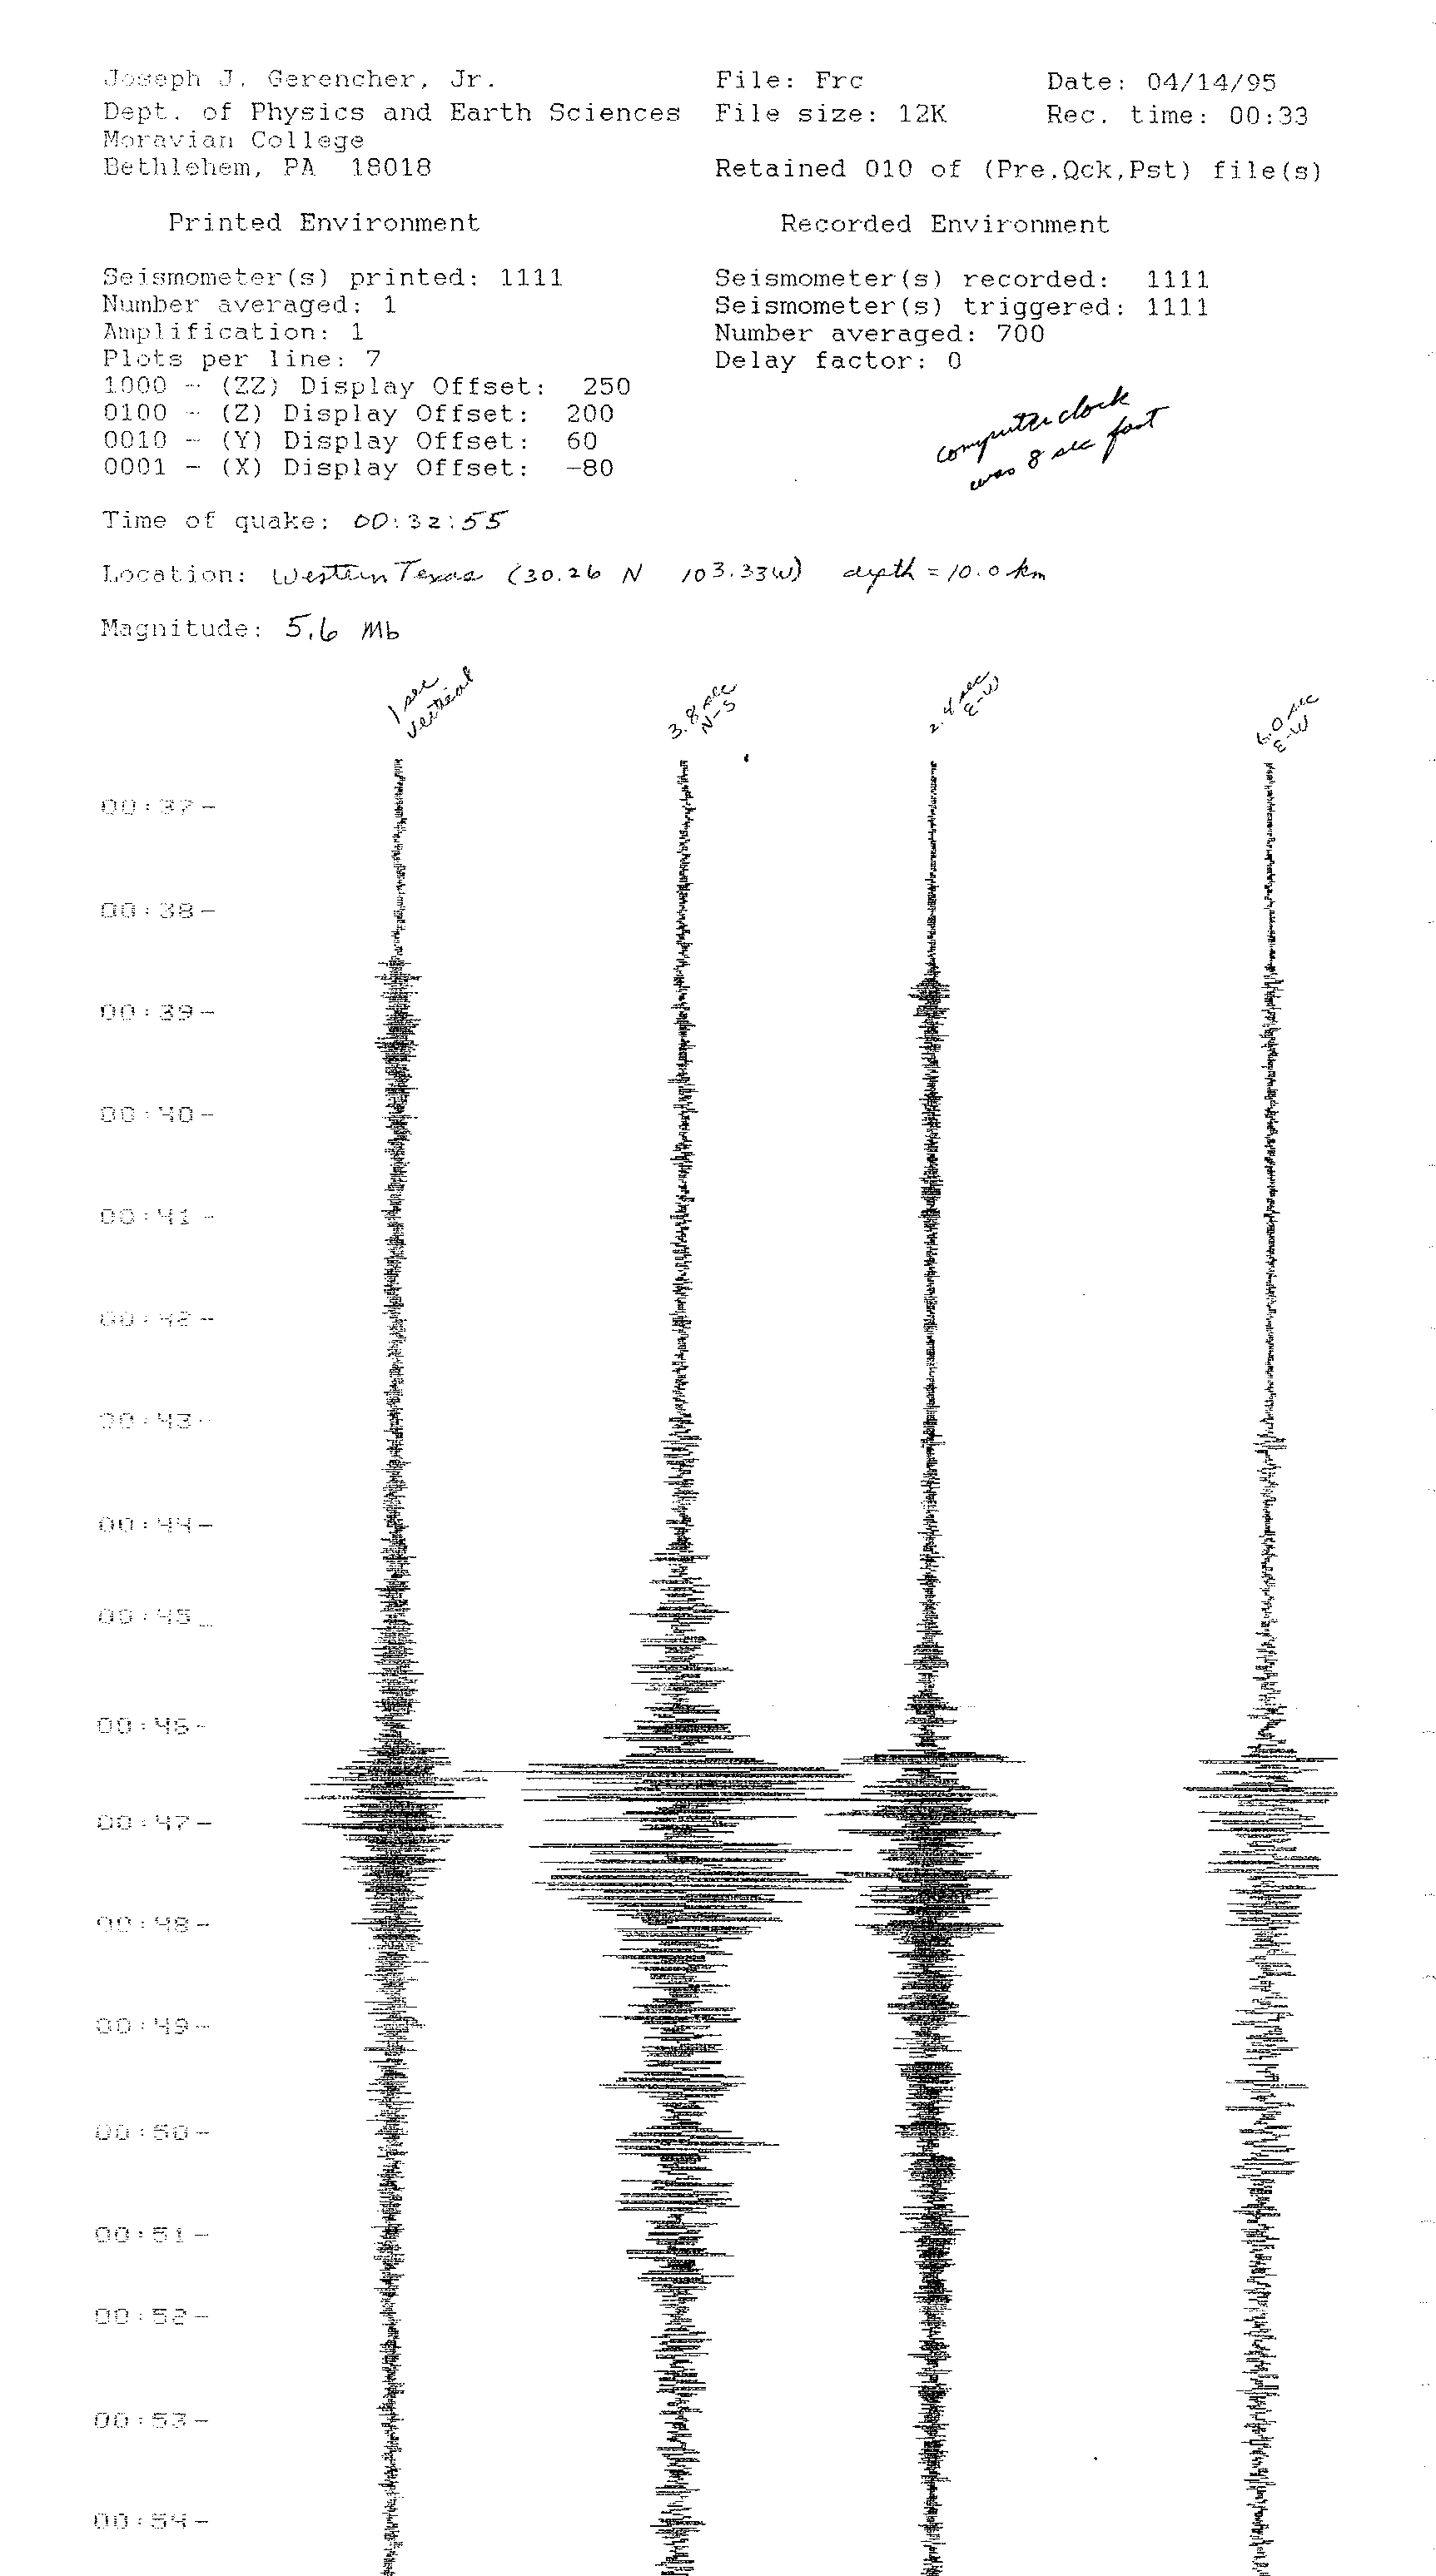
Texas, 04/14/95

Mexico, 09/14/95
Long-period System,
but Printed on a strip Chart Recorder
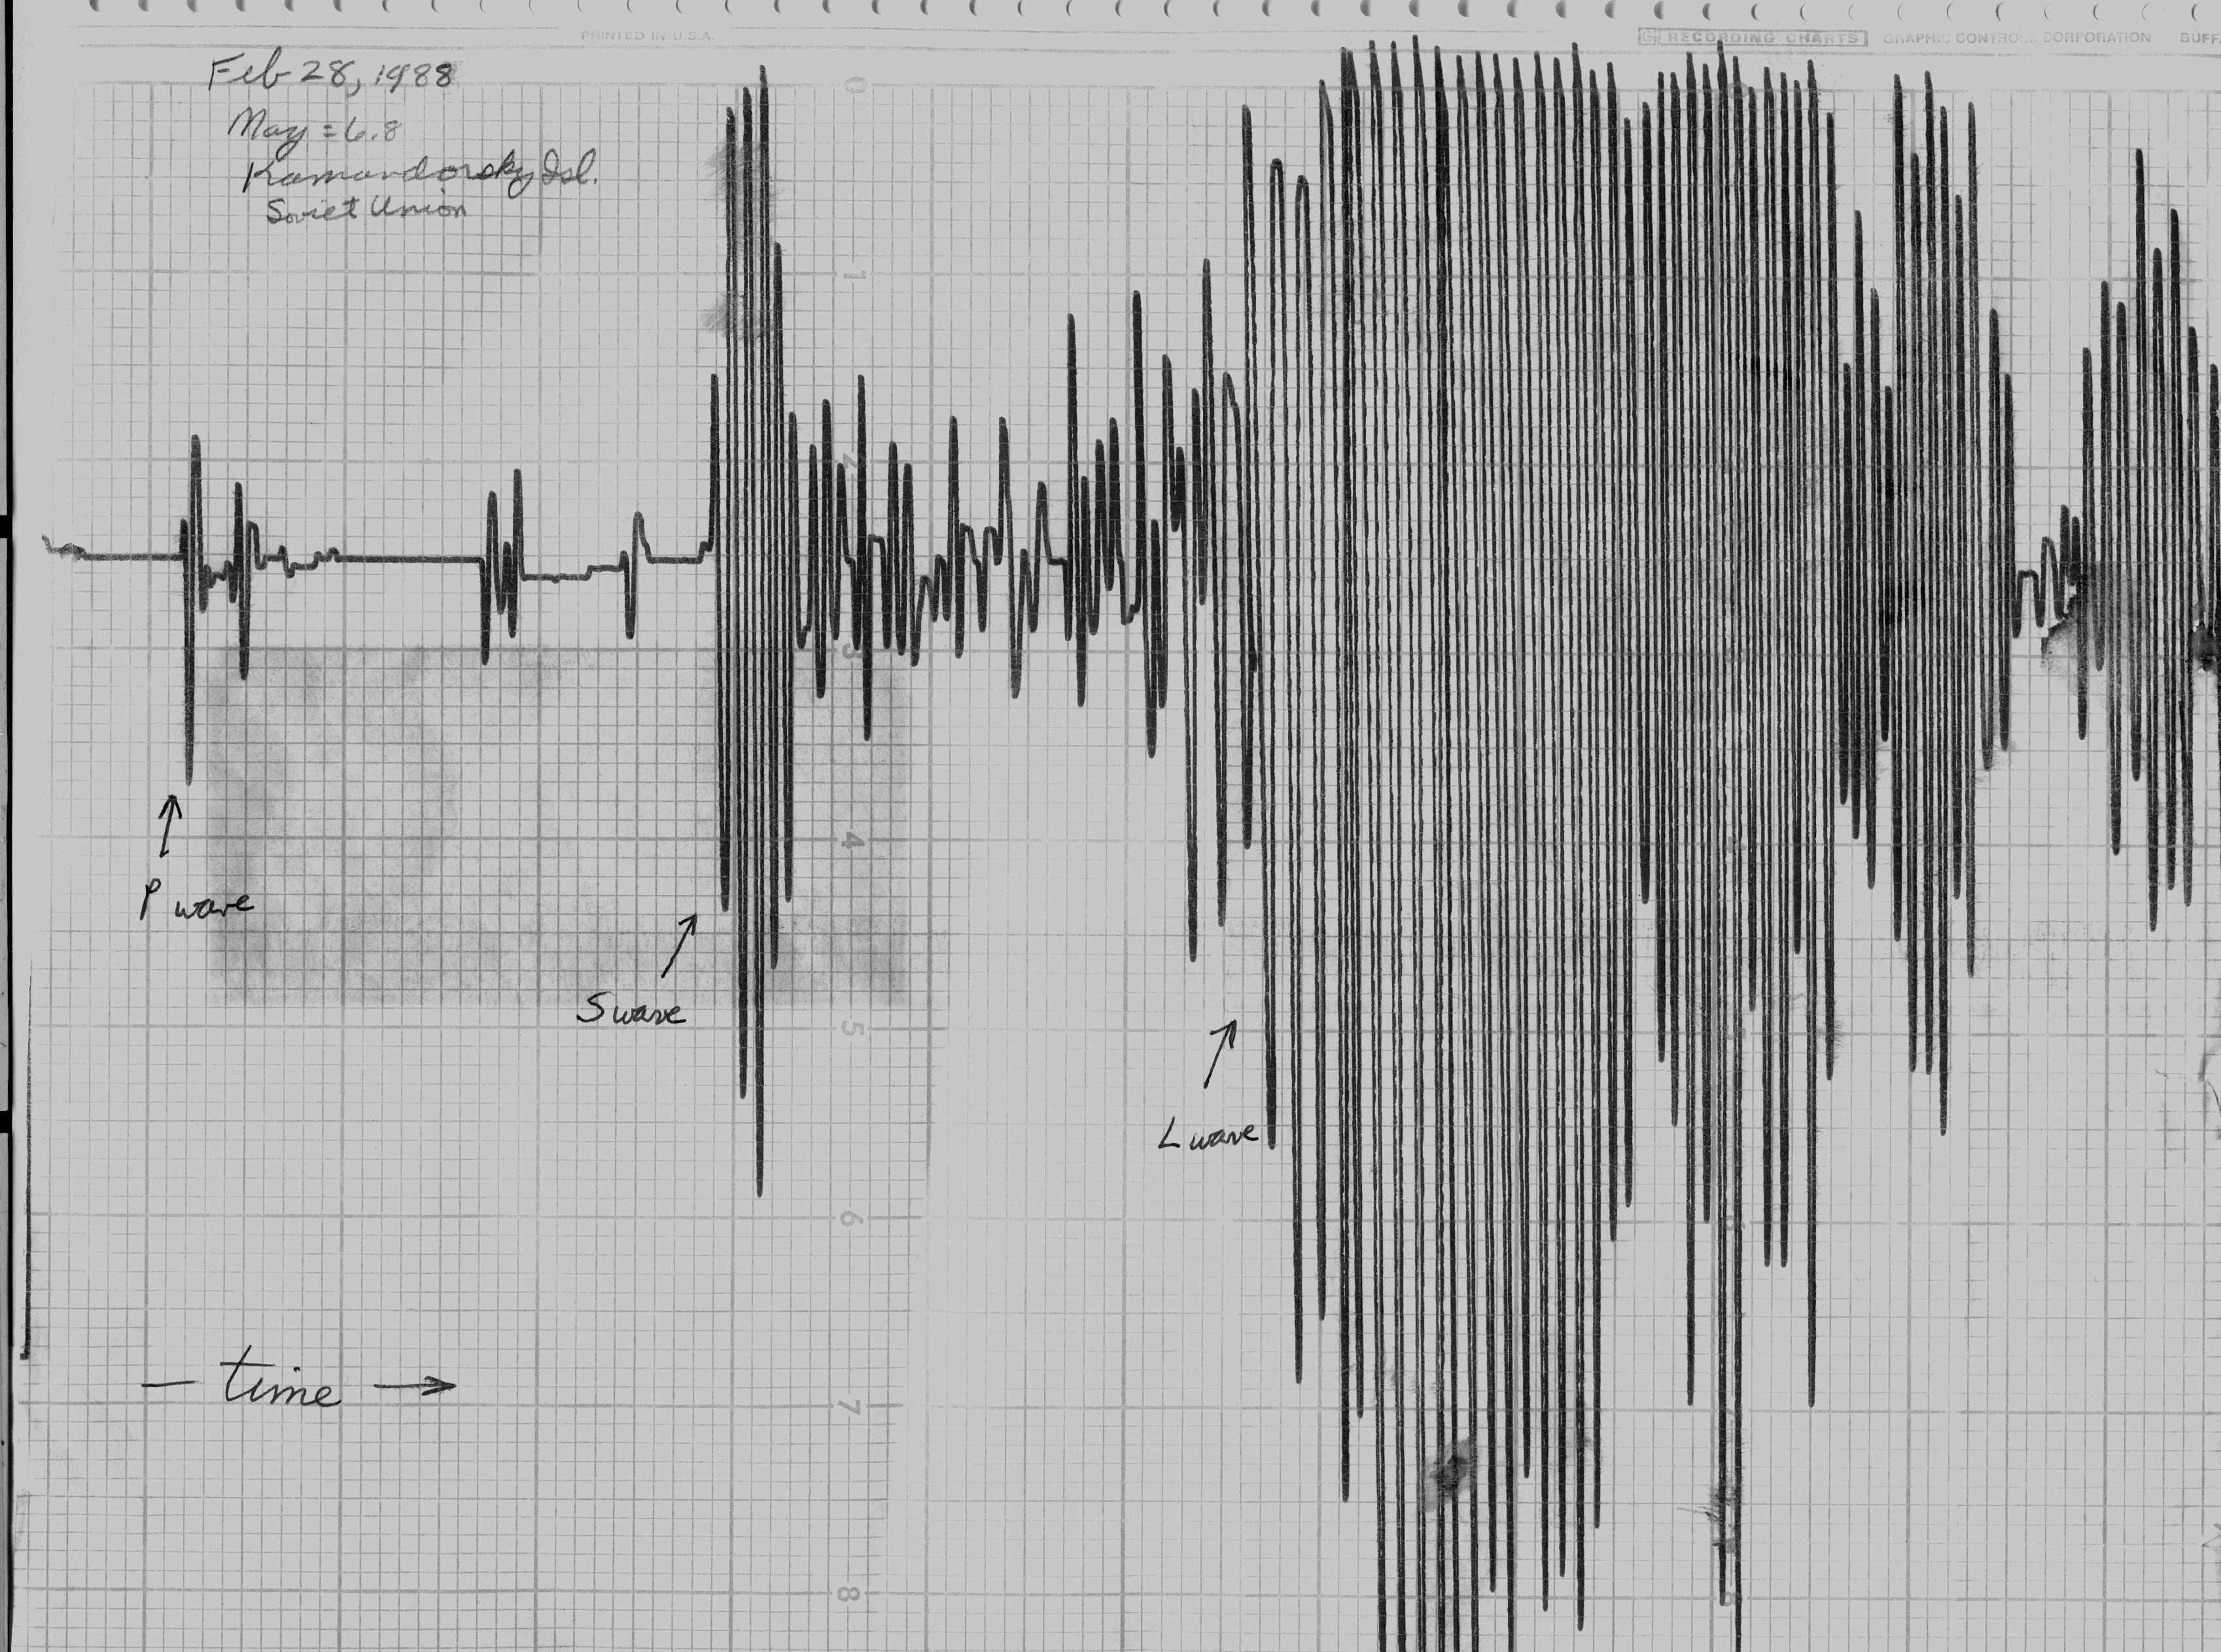
Soviet Union, 02/28/88